Road accidents remain a serious public safety issue across the United Kingdom, yet risk levels vary widely by location. This guide outlines the areas that record the highest rates of collisions, using clear measures such as accident frequency, casualty numbers, and road type. It also explains the local factors that often raise danger, including traffic volume, speeding, junction design, and weather exposure. Understanding where incidents cluster helps drivers plan safer journeys and supports better road safety decisions.
Key takeaways
Road accident risk across the United Kingdom is usually measured by combining how often collisions happen with how serious the outcomes are. Analysts often start with police-recorded injury collisions, then calculate rates per 100,000 residents or per billion vehicle miles to account for differences in population and traffic volume. This approach helps distinguish between a busy area with many journeys and a place where each journey carries higher risk.
Severity weighting also matters. A location with fewer crashes can still rank poorly if it records a high share of fatal or serious injuries. Many studies group incidents by road type, such as motorways, A-roads, and local streets, because speed limits, junction density, and pedestrian activity vary widely between each category.
Reliable measurement depends on consistent sources. Police collision data in Great Britain often comes through Department for Transport road safety statistics, while Northern Ireland uses PSNI official statistics. Some assessments also reference traffic counts, weather patterns, and seasonal effects to explain short-term spikes. Clear definitions, such as what counts as “serious injury”, ensure comparisons remain fair between regions.

Major urban centres tend to record the highest concentration of injury collisions, largely because dense traffic, complex junctions and constant pedestrian movement create frequent conflict points. London often stands out in national datasets, with busy arterial routes, high numbers of cyclists and extensive freight activity increasing exposure at peak times. Other large cities such as Birmingham, Manchester, Leeds and Glasgow also show persistent hotspot patterns around ring roads, multi-lane roundabouts and city-centre corridors where buses, taxis and private vehicles compete for limited space.
Collision risk in cities does not stem from a single cause. Stop-start traffic can trigger low-speed shunts, while higher-speed approaches on urban dual carriageways can lead to more severe outcomes when drivers misjudge gaps or signals. Night-time economies can also raise risk through fatigue and impaired driving, particularly near entertainment districts. Official collision maps and annual summaries from the Department for Transport help identify these clusters, often showing repeated incidents at the same junctions. Local authorities typically respond with targeted measures such as signal timing changes, protected crossings and redesigned layouts, which aim to reduce both collision frequency and injury severity.
Rural and coastal roads can produce severe collisions even when traffic volumes appear modest. Single-carriageway A-roads often combine higher speeds with limited overtaking space, sharp bends and sudden changes in gradient. When drivers misjudge a corner or meet an unexpected hazard, run-off-road crashes and head-on impacts can follow. Risk can rise on routes with narrow lanes, soft verges and limited street lighting, particularly at night or in poor weather. Farm entrances and hidden junctions can also reduce reaction time.
Tourist corridors add a distinct pressure. Seasonal surges bring unfamiliar drivers, motorhomes and caravans, plus frequent turning movements into attractions, beaches and campsites. Queues can form quickly behind slow-moving vehicles, which increases risky overtakes and late braking. Coastal scenery also creates distraction, while fatigue can build during long leisure journeys. Parking searches and sudden stops near viewpoints can add conflict points.
Rural routes also see more vulnerable road users. Cyclists, horse riders and walkers may share carriageways with fast traffic, especially where footways and crossings remain sparse. For national context on collision patterns and contributory factors, consult Department for Transport road safety statistics and Reported Road Casualties Great Britain. Local authority safety audits can also highlight recurring hazards.
Motorways and major A-roads often produce fewer collisions per mile than urban streets, yet they can generate a higher share of fatal and serious injuries. Higher speeds reduce the time available to react, while the forces involved in a crash rise sharply as speed increases. When a collision occurs at motorway pace, even modern vehicle safety features may not prevent life-changing harm.
Several recurring conditions create “blackspots”, meaning locations with a persistent pattern of injury collisions. On high-speed roads, small errors can escalate quickly, especially where traffic flow changes abruptly.
High-severity outcomes also link to the type of incident. Multi-vehicle shunts often follow sudden braking in stop-start traffic, while single-vehicle loss-of-control crashes can occur on bends, downhill approaches or where surface grip changes. In contrast, wrong-way movements and illegal stopping on the hard shoulder can trigger catastrophic impacts.
Official collision records help identify these patterns. The Department for Transport road safety statistics and the STATS19 reporting framework support consistent analysis of contributory factors, road types and casualty severity. Local highway authorities then use this evidence to target engineering changes, enforcement and driver information where the risk of serious harm remains highest.
Drivers can reduce risk in the United Kingdom’s highest-risk areas by planning, observing limits, and managing attention. Before setting off, check the route for known pinch points such as complex junctions, roadworks, or tourist bottlenecks. Live traffic tools can help, yet drivers should avoid interacting with a handset while driving. When conditions change, adjust speed early and keep a larger following distance than usual, especially on wet roads where stopping distances increase.
In urban collision hotspots, prioritise hazard awareness at junctions, crossings, and bus lanes. Give cyclists and motorcyclists extra space, and expect filtering in slow traffic. At night or in heavy rain, reduce speed to match visibility and watch for pedestrians stepping out between parked vehicles. Where freight vehicles operate, avoid lingering in blind spots and anticipate wide turns at corners.
On rural and coastal routes, treat bends, crests, and shaded sections as higher risk. Keep to the left, avoid overtaking unless the view ahead stays clear, and slow before entering a bend rather than braking mid-corner. When visiting unfamiliar areas, expect tractors, horses, and sudden queues near attractions. If fatigue builds, stop in a safe place and take a proper break, since tiredness can impair judgement as much as alcohol.
On motorways and fast A-roads, maintain lane discipline and leave space for sudden braking. Use mirrors frequently, signal early, and return to the left lane after overtaking. In poor weather, reduce speed and increase gaps, as spray can hide hazards. If a breakdown occurs, follow official guidance from National Highways and move to a place of safety where possible. For local safety updates and collision prevention advice, consult the Department for Transport.
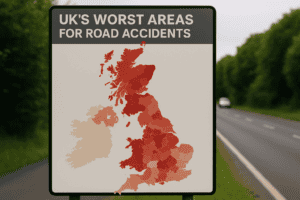
High accident rates per 100,000 people often appear in London and other large urban regions, where traffic density stays high. Several rural areas in the South West and parts of Scotland also record elevated rates because of higher speeds on single-carriageway roads. Local authority data can vary year to year.
Local authorities with the highest numbers of serious and fatal road collisions tend to be large urban areas and major transport hubs. These often include Birmingham, Leeds, Manchester, Sheffield, Liverpool and Bristol, as well as London boroughs. Rankings vary each year, so check the latest Department for Transport road safety data for confirmation.
In the UK’s highest-risk areas, accidents most often involve urban A roads, busy junctions and roundabouts, and local streets with frequent turning movements. Single-carriageway rural roads also feature heavily, particularly where speeds are higher and visibility is limited. Motorways tend to show fewer crashes per mile, but multi-vehicle collisions can be severe.
Urban centres usually record more crashes because heavy traffic, junction density and frequent stops increase minor collisions. Rural areas often show fewer incidents, yet a higher share of serious or fatal crashes due to higher speeds, narrow roads, limited lighting and longer emergency response times. Risk also rises on rural A-roads and at bends.
Higher accident rates often reflect heavier traffic, complex junctions, and higher-speed roads. Urban areas may see more collisions from congestion, pedestrians, and cyclists, while rural areas face narrow lanes, poor lighting, and sharp bends. Weather, road surface condition, roadworks, and local driving behaviour also influence risk, as do enforcement levels and emergency response times.